Member-only story
thinkorswim chart tutorial
3 min readAug 30, 2020
thinkorswim desktop app it’s a popular brokerage to trade stocks. Below are how to steps to modify your charts user interface.
Steps:
- First Create an Account.
2. Install thinkorswim desktop app.
Modify the charts time frame
- Open thinkorswim Desktop
- Click Favorite time frames
- Click on time frame and click edit
- Edit and click Add button
- Click Apply and OK button


Modify the charts ticks
- Open thinkorswim Desktop
- Click Charts
- Click Settings
- Click Appearance, and modified chart user interface.


My configuration:

Before:
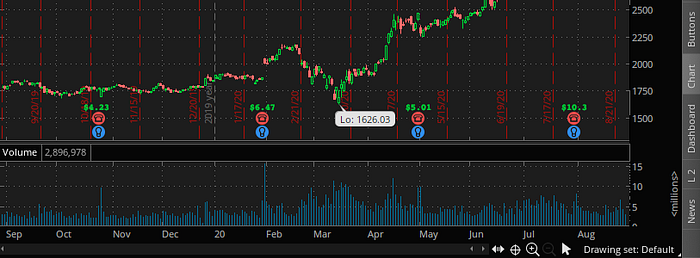
After:

Add VWAP style line to chart
- Open thinkorswim Desktop
- Click Charts -> Studies
- Select “All Studies” -> “V-W” -> VWAP
- Now the chart is going to show VWAP lines in the chart